Epoxid
Compare your current chart with past data
and make your prediction!
It could level up your trading.
Instantly load past data similar to your current chart. Just choose the coin you want.
▌Simple Essential Interface
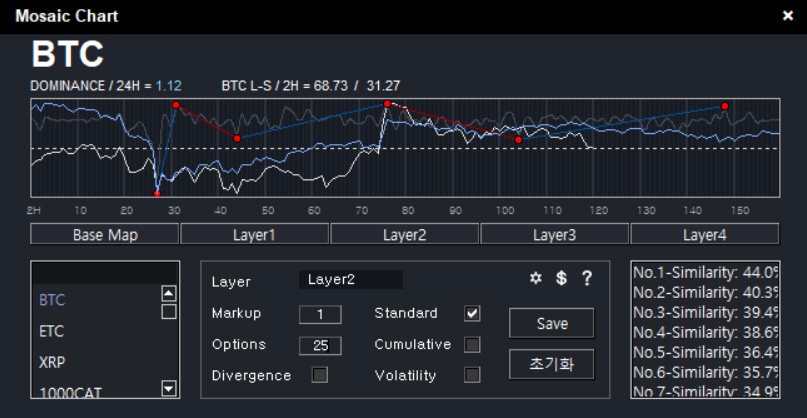
We’ve removed the unnecessary and kept only what matters.
Just choose your coin, and see the results instantly at a glance.
With a clean interface that highlights only the key data,
anyone can understand and use it effortlessly.
▌Core features

▪ Multi-coin support
Currently supports 219 futures-only coins.
To ensure high-quality similarity results, only coins with over one year of accumulated data are included, and the list is updated monthly.
Click to view all supported coins.
▪ Similarity analysis
For each coin, the system loads 30 historical segments that most closely match the current chart, allowing you to anticipate possible future movements.
Each segment can be viewed individually, or merged into a single weighted-average chart by adjusting the Markup and Options values for better clarity.
Once configured, results are automatically refreshed every two hours, so you always see up-to-date analysis without manual input.
▪ Visual clarity
Past data — including Standard, Cumulative, and Volatility charts and key indicators — are displayed together in a mosaic-style layout on a single canvas, making patterns easy to understand at a glance.
With a layer-based structure, you can easily toggle indicators on or off, and each coin’s custom settings are automatically saved for convenience.
▌Serial Registration & Donation
We charge a monthly usage fee to support continuous updates and server maintenance.
Monthly fee: 14 USD (approximately 20,000 KRW).
Instructions for obtaining a serial number can be found in the program’s user guide.